Home / Analytics & reporting
Analytics & reporting
The numbers that decide what you do next week.
What sold and at what real margin, what has been sitting, how prices moved against what you paid, and which listings get seen but not bought. Plus reports you can hand over.
A seller with fifty listings can hold the whole picture in their head. At five hundred the picture stops fitting, and the decisions that used to be instinct become guesses. The analytics here are built around one question — where is the money tied up, and what is it doing while it sits there — rather than around producing a dashboard with many panels and no consequence.
What the catalogue did, not what it felt like.
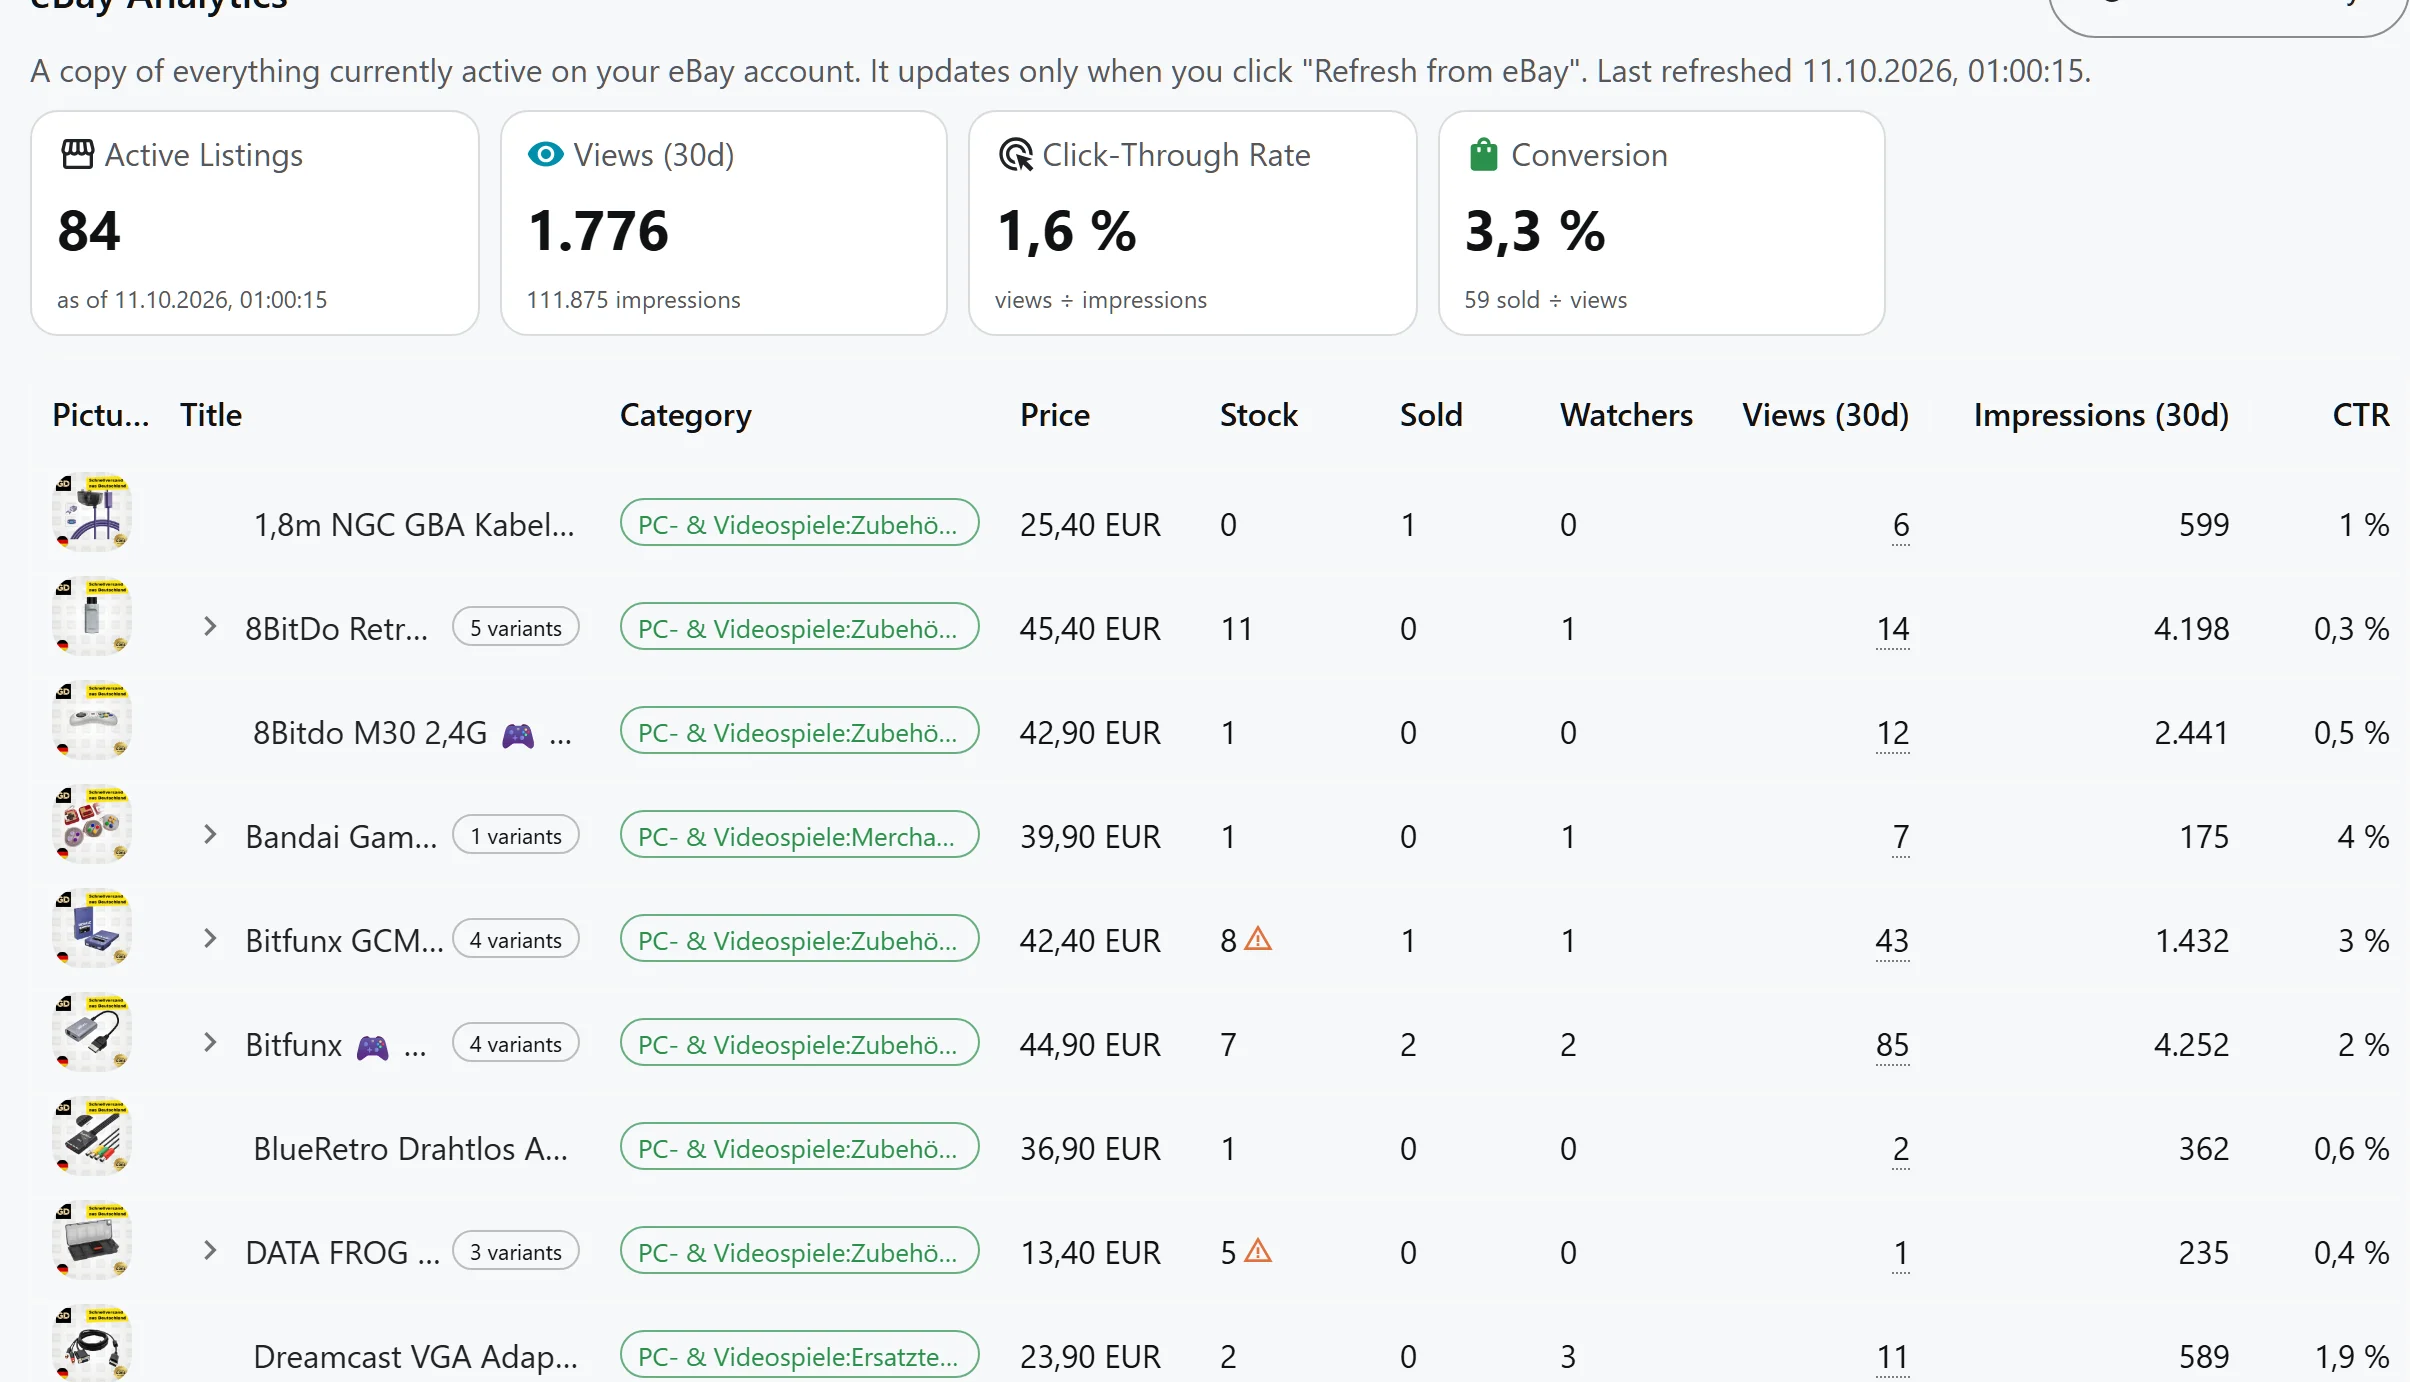
Views, click-through rate and conversion per listing, next to price and stock. A listing seen but not bought reads differently from one nobody sees, and the table keeps the two apart.
What the panels show.
- Sales and revenue — Sales over up to 730 days, with the traffic beside them — impressions, views, click-through and conversion. A listing that is seen and not bought is a different problem from one that is never seen.
- Stock and what it is doing — Inventory value, sold-out items, low stock, what never sold and what ties up the most capital. Price buckets show where the catalogue actually sits.
- Price development — Sale prices over time against purchases at the price actually paid. The question it answers: is your realised price drifting away from your real cost?
- The fees that ate the margin — Final value fees, fixed fees, your share of the shop subscription and ad spend per listing, VAT-aware, in one table.
Seven reports, one button.
- 01. Choose — Price recommendations, sales statistics, supplier orders, order history, active listings, unsold prospects, price development.
- 02. Period — Thirty, sixty, ninety, a hundred and eighty or three hundred and sixty days. The same period runs across whichever reports you take.
- 03. Render — The report is produced as a PDF — A4 portrait or landscape — with the figures and the tables, not a screenshot of a screen.
- 04. Hand over — It is a document your bookkeeper reads without asking which column means what. Print it, send it, file it.
Two scores, and what they are for.
- Profit Efficiency Score — Zero to a hundred and twenty, graded S from seventy, A from fifty, B from thirty, C from fifteen. It ranks a purchase on how well it turns into money, so the next order goes to the supplier items that earn.
- Dead Prospect Score — Zero to a hundred, built from watchers, views and the conversion gap. It ranks listings that attract attention but do not close — the cheapest stock to fix.
- Honest zeros — When a panel has no data because something is not connected, it says why instead of showing a zero. An empty chart that means "not connected" and one that means "no sales" are different facts.
- Ninety days of logs — We keep system events for ninety days, and every user sees their own. Errors are notified rather than waiting to be found.
Questions, answered
Why does a panel say it is unavailable instead of showing zeros?
Because "nothing sold" and "nothing is connected" are different facts. When a source is missing the panel reports that, with the reason, rather than drawing a flat line that looks like a result.
How far back does the data go?
Up to 730 days, which is what the marketplace exposes for orders and traffic. Older data is not invented — it is not available.
Can I export the raw figures?
The reports are PDF documents built from the same figures the panels show. For anything beyond that, the underlying data is your own marketplace data and can be pulled from the source.
Do the reports use my currency and tax settings?
Yes. Amounts use the currency your account works in and the VAT rate you set, and the fee tables respect whether you sell as a private or a professional seller.
Go deeper
- Operations — Where the numbers come from: orders, listings, fees and shipping presets.
- Price intelligence — The advice side — recommendations, bounds and priorities.
- Market intelligence — Your competitors' numbers, read the same way.
Start with the stock you already have.
Connect eBay and the first report is built from your own listings — what has sold, what has not, and what it is costing to wait.
Get Started